

After being involved for many years in the Power BI ecosystem, I understood that making use of external tools like DAX Studio or Tabular Editor when working with DAX is greatly beneficial for increased productivity.
This has changed with the introduction of DAX Query View inside Power BI desktop and more recently, even in Power BI Service.
The DAX Query View now provides a rich code editor with full IntelliSense support providing a huge productivity boost, by being able to try different DAX measures, copying measures in bulk from a different report, or even debugging a measure result (including its context) and this also comes with CoPilot support (dependent on a Fabric capacity).
Where can it be found? In today's blog post we will be looking at how to access it in both Power BI Desktop and Power BI Service.
If you are using a Power BI version from beyond May 2024, the functionality will be directly available, otherwise you will need to activate the preview feature for an earlier version. You will find the DAX Query view button on the left navigation pane.

At the time of writing, this feature is in preview so there's a couple of places where we will need to activate this feature:
Tenant Settings: Admin Portal ➡️ Tenant Settings ➡️ Data Model Settings Category ➡️ Data Models Edit

Workspace Settings: Workspace Settings ➡️ Power BI Section ➡️ General ➡️ Data Model Settings Category ➡️ Data Models Edit

NOTE
You can also check this article on how to activate this setting.
Afterwards when accessing any semantic model, you will see the option either in the more options section at the workspace level, or on the top ribbon when accessing a semantic model.
Now in order to access it, we have two possible ways:
Workspace Level:

Semantic Model Level Artefact:

NOTE
When used within Power BI Service, there are certain limitations that you should be aware of. This includes the fact that queries do not get saved. You can read more about it here.

Highlighted Components:
1) Ribbon - This contains the quick actions we can use while using the DAX Query Editor area.
NOTE
A fun note for all stream deck users and fans, all actions have an associated key stroke combination! Imagine the possibilities!
2) Execution Options - Depending on the context, this will provide the option to Run / Cancel or Commit All Measure Changes.
3) DAX Query View Icon - The menu option will take us to the DAX Query View window.
4) DAX Query Editor - This is where all the magic happens. We can consider this our drawing board to try out things or save different queries.
NOTE
The visual interface allows for the collapse or expansion of different sections of the code through a "folding" feature.
5) Quick Scroll Pane - In case of multiple queries on the same page, this will come in handy for jumping between the different queries.
6) Query Results Output - As the queries are run, this is where the preview will be displayed if it is successful, or where the error message will be displayed (more on this later)
7) Query Pages - This is a very nice option to group certain queries as part of different pages. These queries are also saved within the .PBIX file, or in the .PBIP file format (which will generate different .DAX files for each page/tab).
NOTE
In the case of Power BI Service, the queries are currently not saved. We can perform updates, but the complete DAX Query editor area will be cleared upon exit.
8) Data Model Pane - This will list all the artefacts from the semantic model and will also provide some quick action items depending on the artefact (measure vs. table).
The most important aspect to keep in mind is that we always get a tabular output for DAX queries in the query view. Even for a simple measure, we will still look at a singular column with only one row as output.
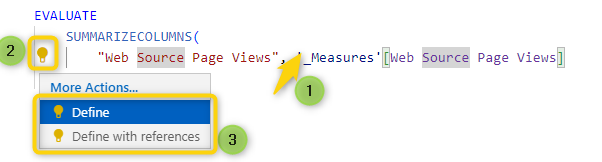
This is an optional command through which a measure will be defined. This can be a completely new measure, or the print of an existing measure and its upstream measure dependencies.
NOTE
The structure for a measure definition will always be: MEASURE 'Table Name' [Measure Name] = DAX Definition
This is the starting point for running a DAX query which needs to be followed by a table expression. In the Query Pane, there can be multiple EVALUATE definitions which will be evaluated separately.
This command can be used as part of an Evaluate command to specify a custom sorting operation.
NOTE
In this article we focused on the three supported commands, however you can read more about all the supported DAX commands here.

By using the Data pane, we can use some very useful quick actions.

Besides the Quick Queries menu section, if a measure is not defined, or has upstream dependencies that were not defined, we can also use DAX Query Editor by hovering over the respective line to bring those definitions in.

When using the DAX Query Editor, we can perform bulk additions of measures or update them. The updates can either be done on an individual level or by committing all the changes at once. What needs to be considered is that committing the changes is an irreversible action, as it cannot be undone.

At the bottom of the page, each page will have a certain indicator depending on if the query was ever run and the outcome of the run.
Let's start by defining the requirements for using Copilot functionalities. Copilot should be enabled at a tenant level and the respective user should have at least contributor role to a workspace backed by a Fabric or Premium capacity.
Once this is out of our way, there are two options to use this feature. From the main ribbon, or by going onto an empty code line.

Once clicked, this will open the Copilot prompt window, which will come with some predefined options, but we can also prompt it to support with the update or generation of a new DAX query. Including prompting it to add sample descriptions for all measures.

You can read more about these functionalities here.
When using the performance analyzer in Power BI Desktop, each visual will have an additional option to run the DAX definition including the current filter context in the DAX Query View.

We can use the Define all measure in this table/model in the current Power BI file and copy the measures into a new Power BI file by committing all changes at once.
We talked about using Power Automate to leverage Power BI data through the Run a query against the dataset action, query which can be stored inside the .PBIX file for easier access to perform changes.
On the Table Quick Actions, we talked about the possibility of checking the data quality through the Show column statistics quick action. Of course, that DAX expression can be further tweaked, but it is an amazing starting point.

With the introduction of the DAX Query View in Power BI, creating, debugging, and managing DAX measures has never been easier. By utilizing its advanced features, you can streamline your workflow and enhance your productivity out-of-the-box. Whether you're working in Power BI Desktop or Service, this new functionality provides you with greater control and efficiency. So why wait? Start exploring the DAX Query View today!
